None of us want to look into a production audit system, as this most likely happens after a security breach or a security incident. Over the years, people have come up with many ideas to see what applications are doing. Almost all databases keep event logs to prevent data loss. Systems such as Kubernetes generate events for every action, and applications that probably run in your production also implement some structured logging for the same reason. But what can we do if all of that is not enough? What if someone finds a way to run a remote shell on your machine or escape your production sandbox? What if one of your former employees who have access to machines decides to copy or remove some files from them? Ideally we’d have a tool that would allow us to log such events without manually instrumenting all installed applications.
Linux Audit Framework, also known as auditd, was created to address the above problem. Linux Audit Framework allows a system administrator to log different system events and use them for post-mortem analysis. You can think about it like a “black box” on an airplane. Event logs often contain helpful information like executed commands, system calls, file access information and network statistics.
To understand what makes auditd unique, we need to discuss system architecture. Most auditing tools require some integration with a running application, meaning we could miss important information if this isn’t done properly. Integrating such tools into all environments typically requires a lot of work and discipline.
In contrast, Linux Audit is a module built directly into the Linux kernel. That gives it the capability to see all actions from the kernel’s perspective. Conveniently, it is also highly configurable, which allows most users to find the sweet spot and avoid too much noise.

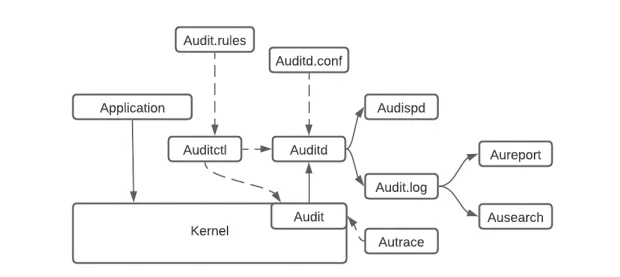
Image from Article Auditd: Rule Writing for better Threat Detection on *nix Devices
As shown in the diagram above, there are no additional layers between the application and the kernel.
Instead, all events are propagated to auditd (audit demon) that run in the user-space directly from the kernel via a netlink. Auditd is then responsible for saving all events on the filesystem. It also offers everything we would expect from a Linux daemon, such as log rotation, disk-free space monitoring, etc. If the daemon is not running, all events are “printed” in the kernel and can be found in dmesg.
We’ve already talked about what auditd is and what it can do. Let’s see now how we can use it in practice. There are a few ways how we can inspect events generated by Linux Audit:
The most obvious is the log file located at /var/log/auditd.log on most systems. That file contains all events logged by the userspace process called auditd. When the auditd process is not running, all audit events are printed by the kernel and can be found in dmesg with the rest of the other kernel messages.
As the auditd log file contains raw data, it’s not easy to find the information that we need. For that reason, auditd comes with command line tools. We will talk about them more later in this article.
The last option you may pick is a netlink connection. If you’ve never heard about netlink, it’s a replacement for ioctl. It allows talking directly to the kernel without much overhead. Exchanging information require some kernel knowledge as messages are sent in a binary format.
If you don’t want to dive too deep into kernel programming, you can also use audit-userspace https://github.com/linux-audit/audit-userspace library, which offers C API that implements most technical details for you.
It’s important to mention that there can be only one read of Linux Audit messages. So if you decide to read messages in your application, remember to disable auditd. Otherwise, you won’t see anything.
Auditd wouldn’t be very useful without tooling around it. Linux Audit is distributed with a handful of tools that allow us to change the daemon behavior, search through events and print system statistics. Let’s see what is available to us out of the box.
autrace – trace only one process executionautrace allows to run a process and record everything that happens. Below example shows how to run ls:

The generated log doesn’t show many details, but the last line points us to another handy tool
ausearch – grep for infinite logsAs I mentioned earlier, auditd even with the default configuration, records many events. To better understand system behavior, ausearch provides a wide variety of filters, like filtering by PID, user, session ID, time, etc.
Below is an example output of listing all events by a PID.
# ausearch -i -p 153153
----
type=PROCTITLE msg=audit(08/16/2022 01:01:40.493:5126) : proctitle=autrace /bin/ls
type=SYSCALL msg=audit(08/16/2022 01:01:40.493:5126) : arch=x86_64 syscall=close success=yes exit=0 a0=0x4 a1=0x0 a2=0x7f8e619ea160 a3=0x7f8e61a710c8 items=0 ppid=153151 pid=153153 auid=john uid=root gid=root euid=root suid=root fsuid=root egid=root sgid=root fsgid=root tty=pts4 ses=213 comm=autrace exe=/usr/sbin/autrace subj==unconfined key=(null)
----
type=PROCTITLE msg=audit(08/16/2022 01:01:40.493:5128) : proctitle=autrace /bin/ls
type=PATH msg=audit(08/16/2022 01:01:40.493:5128) : item=0 name= inode=7 dev=00:18 mode=character,620 ouid=root ogid=tty rdev=88:04 nametype=NORMAL cap_fp=none cap_fi=none cap_fe=0 cap_fver=0 cap_frootid=0
type=CWD msg=audit(08/16/2022 01:01:40.493:5128) : cwd=/tmp/a
type=SYSCALL msg=audit(08/16/2022 01:01:40.493:5128) : arch=x86_64 syscall=newfstatat success=yes exit=0 a0=0x1 a1=0x7f8e617d846f a2=0x7ffffc4624e0 a3=0x1000 items=1 ppid=153151 pid=153153 auid=john uid=root gid=root euid=root suid=root fsuid=root egid=root sgid=root fsgid=root tty=pts4 ses=213 comm=autrace exe=/usr/sbin/autrace subj==unconfined key=(null)
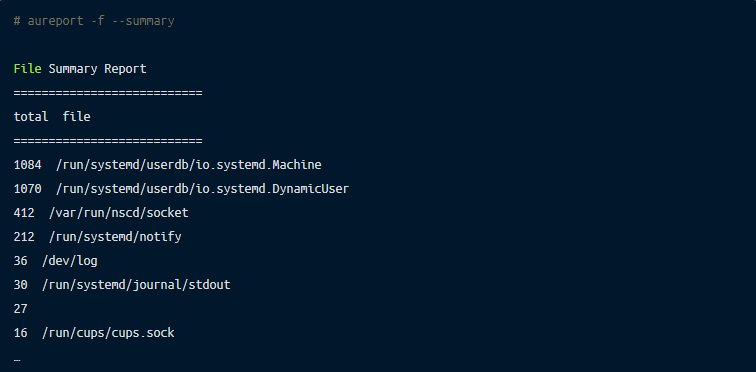
aureport – aggregate all eventsSometimes we don’t want to see all individual events but a summary of what has happened in the past. Here aureport comes very handily and can help to answer many questions with just a few keystrokes:
Who has logged into a machine?

Who has tried to log into a machine and failed?

What files were accessed?

Input from a TTY? Anomaly report? No problem. These and many other reports can be quickly generated to see an overview of a system.
auditctl – audit controlauditctl is a daemon control tool that allows getting and modifying auditd settings. Probably one of the most useful things that auditctl can be used for is listing all active rules:
auditctl also allows to check the status (-s) or add new rules.
Remember that all rules set by auditclt will disappear after a restart. To make a rule permanent, it needs to be added to the configuration file.
So far, auditd looks like a flawless system that fits everyone’s needs. But unfortunately, the reality is not so simple. For example, one of the main problems many users face after enabling Linux Audit is the performance cost.
Another potential pitfall many may not realize is auditd behavior when there is no more free disk space left. Auditd with default configuration will just log a warning message and stop recording events to a persistent disk. When this happens, our event log may miss important events and make potential analysis impossible. Thankfully, this option can be changed by setting disk_full_action to HALT or SUSPEND in the audit configuration.
A similar problem can also be caused by a default flush policy set to INCREMENTAL_ASYNC or INCREMENTAL. Some events cannot be fully synced to a disk, which creates a partial image of the situation.
Linux kernel comes with many features. One of them is Berkeley Packet Filter (BPF) which has gained much popularity over the last few years. BPF was not designed for auditing purposes but rather as a way to execute user-written code in the Linux kernel safely. BPF compiler makes sure that provided code won’t crash and always terminates. That makes it a safer alternative for the kernel modules, which can crash the whole system. If you’ve never used BPF in the wild, the easiest way to start is to use bcc https://github.com/iovisor/bcc tool. This package comes with around 100 scripts (at the moment of writing). Simple applications allow you to take advantage of BPF in your system without writing any code.
Going back to our previous example with tracing connect system call, let’s see how we can achieve the same using BPF. Fortunately, bcc comes with an already written script called tcpconnect, which allows us to list all calls to connect.
Here is some example:

Because BPF runs in the kernel the same as Linux Audit, it has access to all syscalls, which allows similar gathering of information. Of course, we could also use Linux Audit to get the same information. First, we need to add a new rule to auditd:
Then, in our audit log, we should see events like that:
type=SYSCALL msg=audit(1660767405.354:6493): arch=c000003e syscall=42 success=yes exit=0 a0=7 a1=7f4c040015f0 a2=1c a3=0 items=0 ppid=268860 pid=272050 auid=1000 uid=1000 gid=1000 euid=1000 suid=1000 fsuid=1000 egid=1000 sgid=1000 fsgid=1000 tty=pts0 ses=283 comm="curl" exe="/usr/bin/curl" subj==unconfined key=(null)ARCH=x86_64 SYSCALL=connect AUID="john" UID="john" GID="john" EUID="john" SUID="john" FSUID="john" EGID="john" SGID="john" FSGID="john"Is BPF capable of replacing Linux Audit? I think so. BPF it’s a powerful technology adopted by many companies like Google, Meta, Netflix, and Remoteler. It allows the creation of more customizable solutions targeting more specific problems, not only auditing.
Will BPF replace Linux audit? Maybe. Netflix, for example, uses BPF to trace network packages using less than 1% of CPU and memory. Uber created a load testing framework that can automatically adjust the network traffic to reduce the need for manual adjustments and increase the test coverage. Remoteler uses BPF to trace user activity during a remote session, which can replace the need for Linux Audit.
Auditd is a solid and very robust auditing system. Implementation in the Linux kernel makes it very powerful and widely accessible. This article covered why Linux Audit was created, its architecture and its usage. We also showed some more modern alternatives.
References: